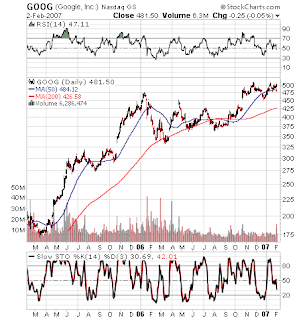
 A few emailers asked me to put up a longer term chart of Google. So here it is. This is a case of be careful of what you ask for. This longer term chart shows a double top M formation in the making. 2006 all over again. The longer term chart makes it much more clear that 450 looks to be the next downside target, though I will concede that perhaps, maybe that October 2006 gap won't be completely filled just as the October 2005 gap wasn't completely filled. But there's no law that says the Google has to defy gravity since the longer term chart shows that nasty early 2006 pullback. Maybe it was better that I just showed that short term chart?? The message is perfectly simple, the meaning is clear... 3rd quarter earnings were supposed to be the catalyst, they weren't... look out below. One hope: maybe GE, XOM, MRK, MMM, UTX and KKR, plus Terry Semel throws in some cash from an advance from his Centurion Black Amex card for a big joint GOOG bid this Monday? I don't think so.
Saturday, February 3, 2007
Google Long Term Chart
 A few emailers asked me to put up a longer term chart of Google. So here it is. This is a case of be careful of what you ask for. This longer term chart shows a double top M formation in the making. 2006 all over again. The longer term chart makes it much more clear that 450 looks to be the next downside target, though I will concede that perhaps, maybe that October 2006 gap won't be completely filled just as the October 2005 gap wasn't completely filled. But there's no law that says the Google has to defy gravity since the longer term chart shows that nasty early 2006 pullback. Maybe it was better that I just showed that short term chart?? The message is perfectly simple, the meaning is clear... 3rd quarter earnings were supposed to be the catalyst, they weren't... look out below. One hope: maybe GE, XOM, MRK, MMM, UTX and KKR, plus Terry Semel throws in some cash from an advance from his Centurion Black Amex card for a big joint GOOG bid this Monday? I don't think so.
Subscribe to:
Post Comments (Atom)

1 comment:
Well I am glad that you do not fall into the sheepish Cramer camp. The only thing that guy and I have in common is that we are Democrats, LoL.
Anyways, in regards to Google stock there are signs that an reverse "bullish" head and shoulders pattern is also in formation. If the stock holds above approx. $465, trends sideways and builds momentum, there should be an eventually breakout to the upside.
To me there wasn't enough downside pressure following earnings. a 20-point drop in price is very small in percentage terms. All bets are off if the stock drops below ~$455. It is then that your bearish double top will have me running and taking profits off the table.
Good Investing...
--
Stephen
www.jutiagroup.com
Post a Comment